Every entry graded
Elite-tier backs, early-RB timing, depth, what your quarterback cost, tight end plan, stacks, bye overlap and value against ADP — scored, ranked and explained per roster.
A realistic ceiling
Scores are calibrated against what teams with that construction actually did. No fantasy numbers: the top of the scale is what the best-built rosters really hit.
Odds of a profitable season
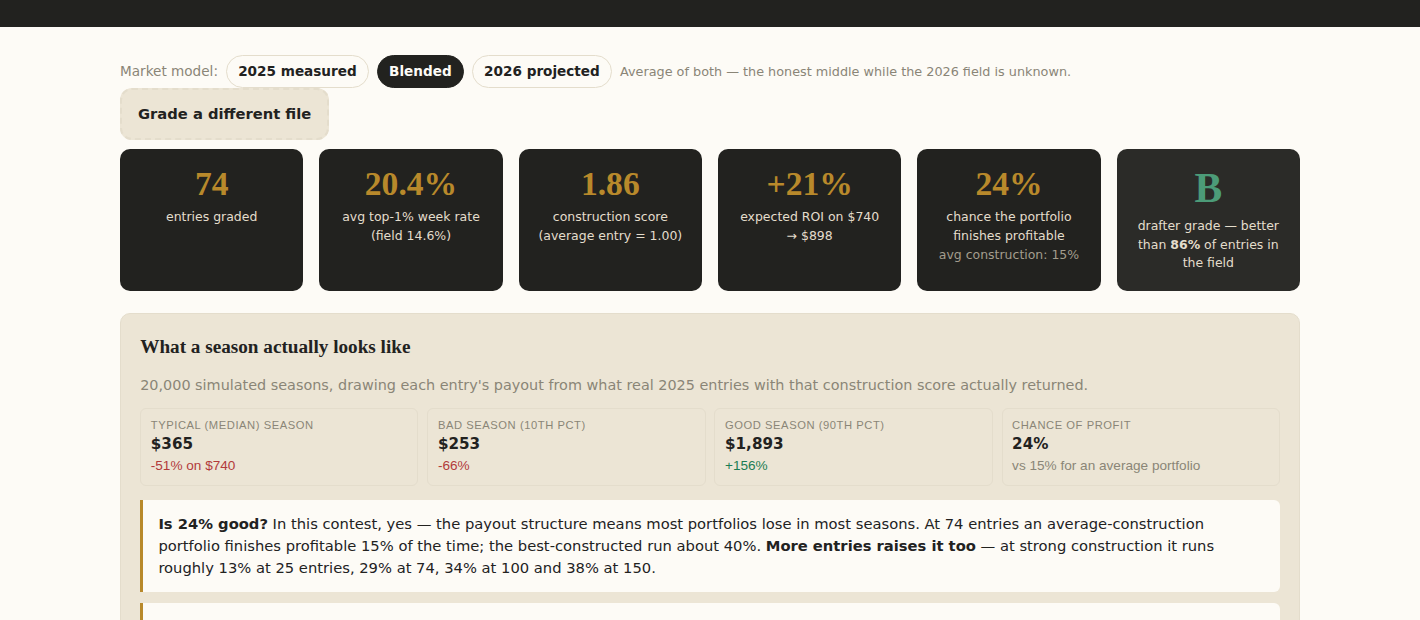
20,000 simulated seasons redrawing each entry's payout from real 2025 results at its score — median season, bad season, good season, and your chance of finishing up.
Your weakest link
Per entry and across the portfolio: the one choice costing you most, what the better option was worth, and the biggest gain still available.
Player filter
Type any player to see your exposure and whether he's landing on your strong builds or your weak ones. Stacks with autocomplete.
Market-model toggle
Score at 2025 measured values, 2026 simulated values, or blended — the exact uncertainty the article is about, applied to your own teams.
What it looks like
Get it
How it works: pay once, and you're taken straight into the grader — no account to create. You'll get an access key to save, which unlocks it on any other device. Access runs through the 2026 season, and updates are included.
Your draft data stays yours. The file is read in your browser and only anonymous shape numbers are sent for scoring — never player names, never the file itself.
Buy the Portfolio Grader — $10
Questions
Where do I get the file?
In the Underdog app, open NFL 2026 Weekly Winners Season → Email exposure CSV. Underdog emails you the file; save it and drop it in. That export is already just your Weekly Winners entries, so there's nothing to filter or clean up.
Does it tell me who to draft?
No. It grades construction — the shape of your rosters and the prices you paid — which is the part a full crawl of the field can actually measure. It won't project players.
Is the scoring just last year's numbers?
Every lever was measured on the 2025 field, then re-tested against a simulated field at 2026 prices. Where the two disagree you can see both, and the default sits between them. The article explains exactly where and why they diverge.
How accurate is the expected ROI?
It's the average payout of real 2025 entries at each construction score, so it includes the jackpots — a genuine expectation, but a volatile one. The tool shows the median season alongside it, which is the one you'll usually live in. Read both.
Does buying this make me money?
Most portfolios lose in most seasons — that's the payout structure, not the tool. Good construction moved the odds of a profitable season from roughly 16% to 24% at 74 entries in 2025. That's the honest size of the edge.