Last season I won Week 8 of Weekly Winners with a build that looked like a mistake: four running backs in the first four rounds. Saquon Barkley, Bucky Irving, Jonathan Taylor, James Cook. The fourth back was supposed to be useless. It was worth $20,000.
So I crawled the entire contest — every entry, every pick, every result — to find out whether that was luck or structure. The answer was structure, and it was dramatic. Teams that took four backs in the first four rounds reached a top-1% week at 2.06 times the field rate. Three backs: 1.61×. The curve climbed at every step.
That finding was true. It is also, I now think, mostly impossible to achieve — and I'd rather tell you that than sell you last year's edge at this year's prices.
The problem with any full-field study
Every number in that study was measured against 2025's draft board. When I say "four running backs in the first four rounds," what I really measured was "four backs bought at 2025 prices." In 2025, the twelfth-best running back by ADP went at pick 30. You could build that roster from many draft slots without extraordinary sacrifice.
In 2026, RB12 goes at pick 19.
The entire ceiling tier is gone by the end of round two. Twelve backs now come off the board inside the first 24 picks, against ten last year, and the mid-tier moved up as well. The build I won with hasn't gotten slightly more expensive. Its impossible to achieve.
Which raises a question I couldn't answer by staring at the 2025 data any harder: do the rules survive the repricing?
Building a 2026 field out of 2025 results
Here's the test I ran.
I took every 2025 player and kept their actual weekly scores — the real thing that happened, week by week, all 17 weeks. Then I re-priced them. Not by guessing: 2025's RB1 by ADP was assigned 2026's RB1 price, 2025's RB19 got 2026's RB19 price, and so on for every position. Positional rank preserved with 2026 ADPs in place of 2025.
Then I simulated a field. Fifteen thousand twelve-team snake drafts — 180,000 entries — with drafters following the new ADP with realistic noise. I calibrated that noise against how the real 2025 field actually deviated from ADP: tight in round one (standard deviation of about 3 picks), widening to roughly 12 by round 15. I enforced the same roster minimums the real contest does.
Then I scored all 180,000 rosters on real 2025 weekly results, set the optimal lineup for every team in every week, and ranked them.
The simulation reproduces the contest almost exactly.
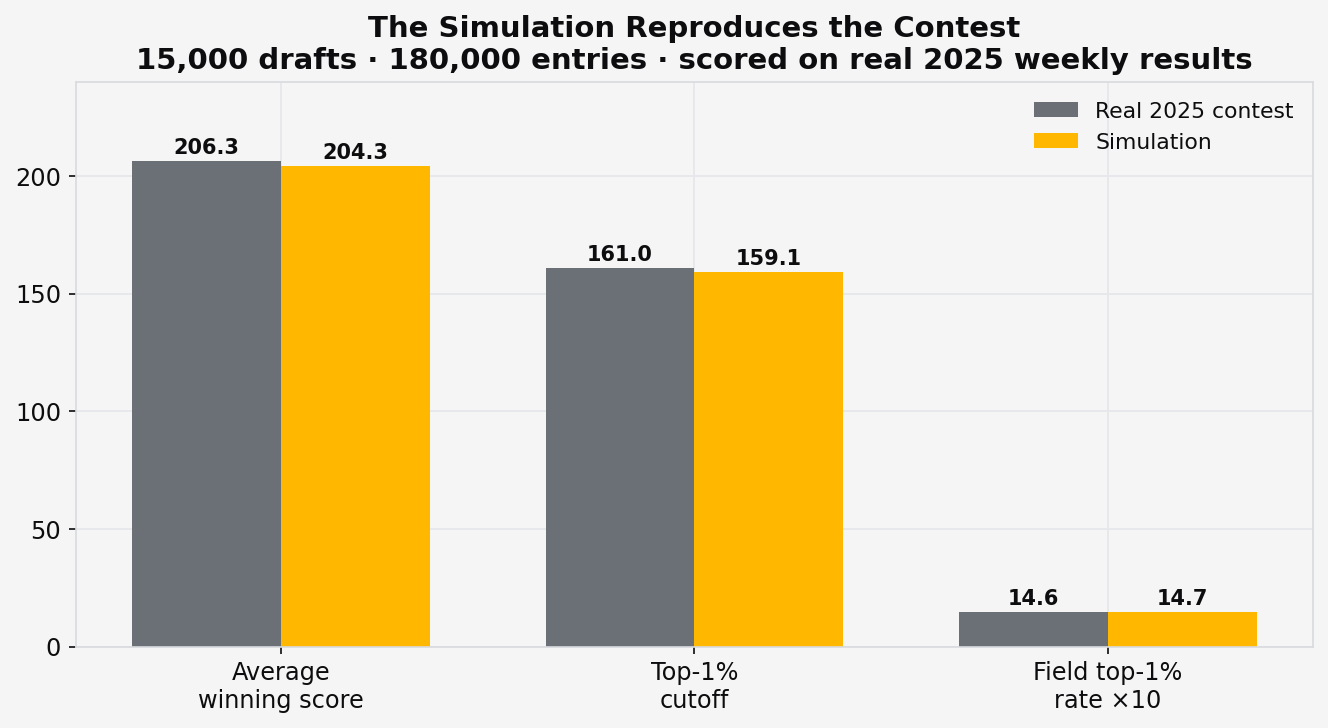
Average winning score: 204.3, against the real contest's 206.3. Top-1% cutoff: 159.1 against 161.0. If the data was broken, this would show up.
What this test isolates is precisely the thing I wanted: the players and their results are held constant, and only the draft board changes. Any difference in the findings is a price effect, not a performance effect. Essentially, how can we use this info to draft in 2026.
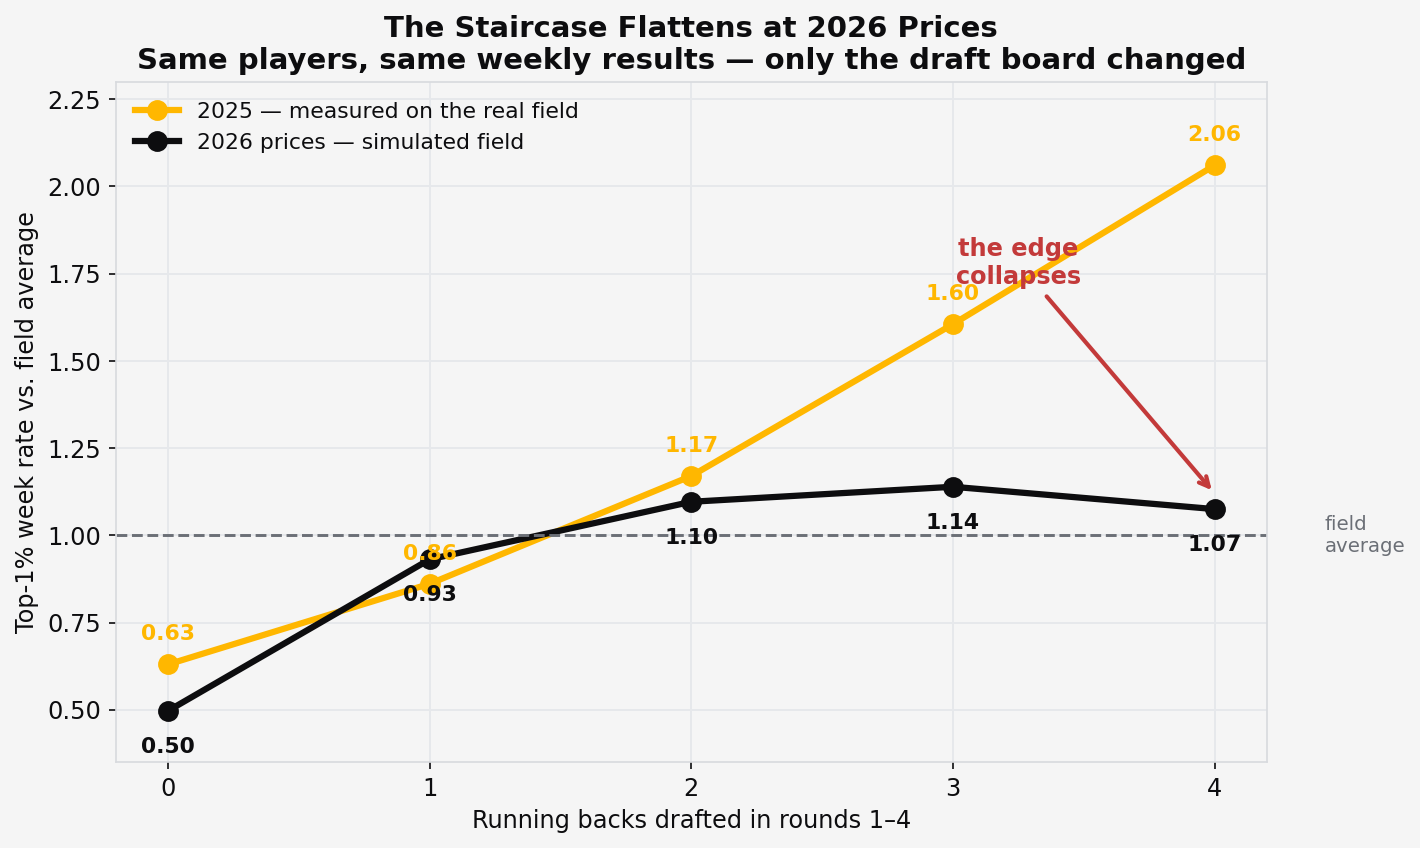
The staircase flattens
At 2025 prices, the curve climbed relentlessly: 0.63 → 0.86 → 1.17 → 1.61 → 2.06.
At 2026 prices, it goes 0.50 → 0.93 → 1.10 → 1.14 → 1.07.
It peaks at three early backs and then turns down. The four-RB build — the one that won me a week and started this entire project — retains almost none of its edge. Two-thirds of the way up the staircase survives. The top step isn't a cliff, but it's no longer positive.
(On the extreme tail, the very top-0.1% cut, four backs still edges ahead at 1.20×. The nuclear-ceiling case survives in just in a weaker form. But as a general rule, three is now the target.)
Why: the field moves with the prices
Obviously it's not because early running backs stopped being good, they were the same players producing the same results. It's that at 2026 prices, following ADP naturally produces an RB-heavy roster.
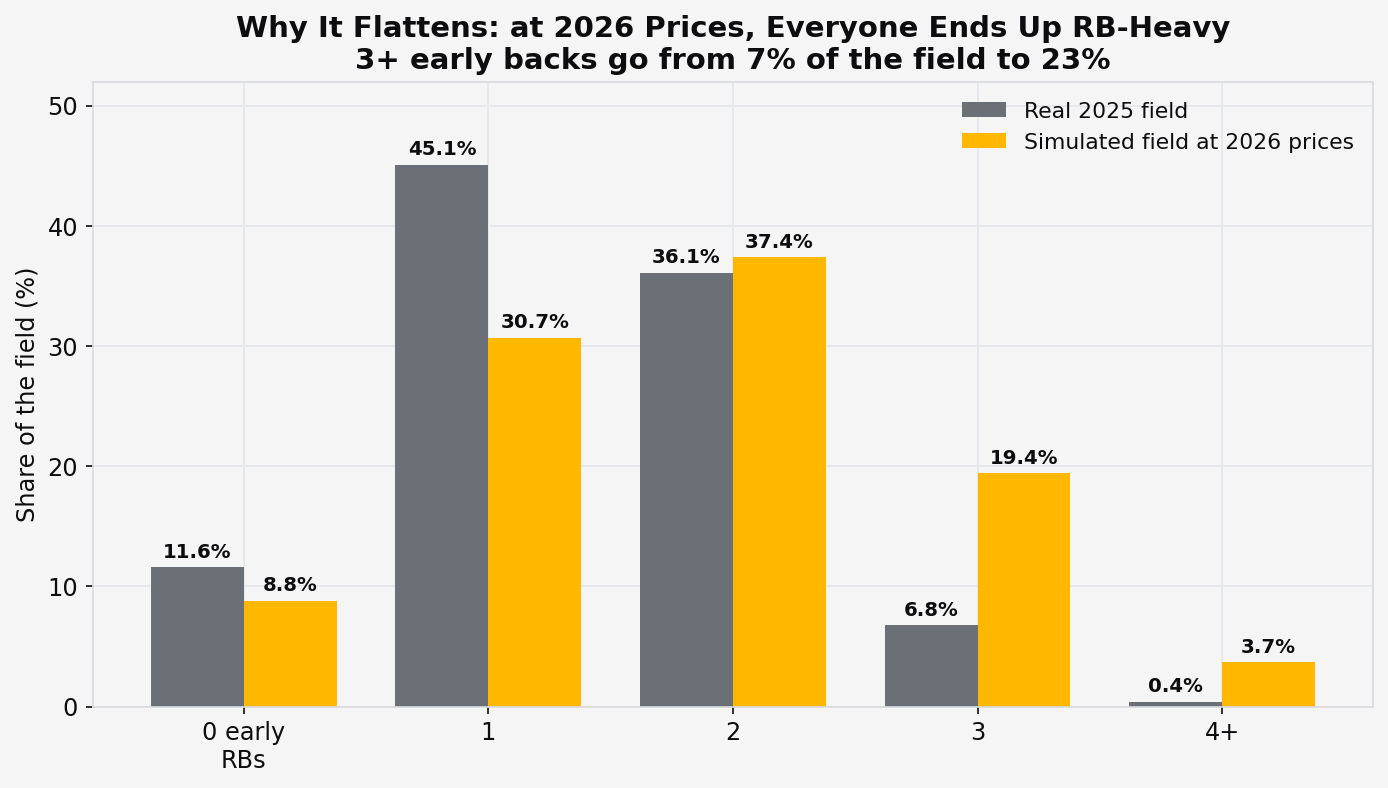
In the real 2025 field, 7.1% of entries took three or more backs in the first four rounds. In the simulated 2026 field, that becomes 23%.
The 2025 edge existed because almost nobody was doing it — you were buying scarce ceiling at a discount the market hadn't corrected. Price everyone into the same build and it stops being leverage and starts being the field.
You may have heard me on Off and On The Clock with Pete Overzet and The Badge Bros talking about this. When we talked, I hedged on a lot of the data being the 2025 prices. Here's the follow up to that appearance: a structural edge measured in one price regime is partly a statement about what the field was doing, not only about what wins. Any strategy finding that isn't re-tested when prices move is a finding with an expiry date.
What survives
Some of the things we talked about on my appearance became stronger, some remained the same, and some became much harder to accomplish.
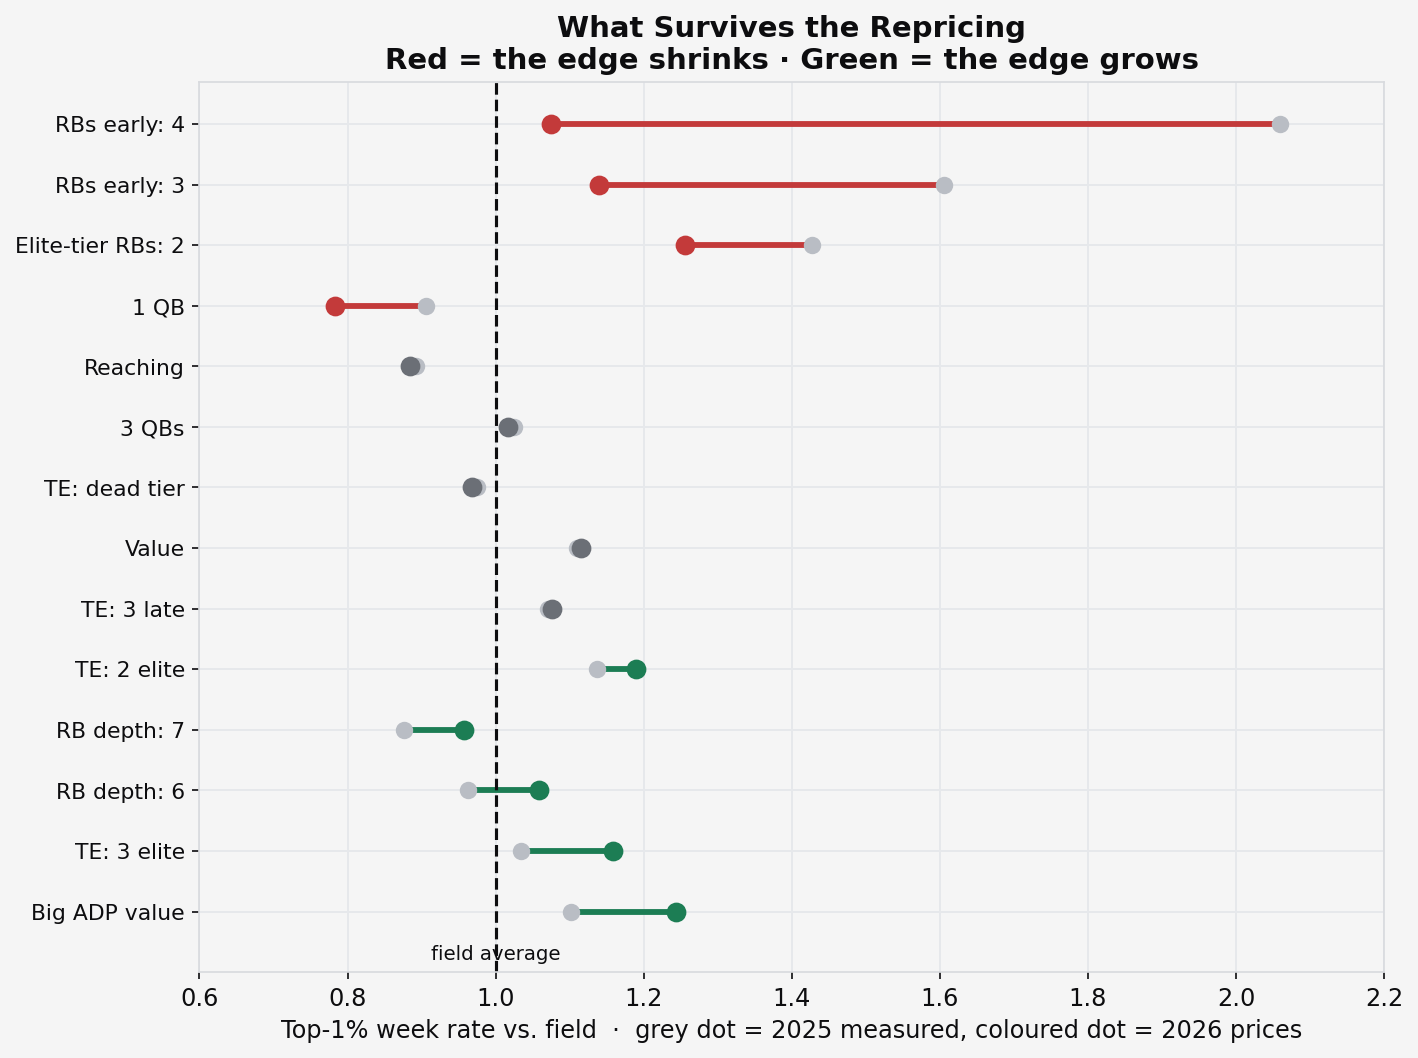
The RB timing levers took the damage. Four early backs: 2.06 → 1.08. Three early: 1.61 → 1.14. Two elite-tier backs: 1.43 → 1.26.
Running back depth got more valuable, not less. Six total backs went 0.96 → 1.06; seven went 0.88 → 0.96, while three or four total got worse. When the elite tier costs more, you need more bodies behind it — the redundancy argument survives even as the early argument weakens. And if you think the relative health we've had at RB the last two seasons changes, there is even more reason to lean into this.
The tight end barbell strengthened. Three tight ends with an elite one: 1.03 → 1.16. Two with an elite one: 1.14 → 1.19. The dead middle tier — TE4 through TE10, the veteran name-brand band — stayed dead in both worlds (0.97).
Value discipline strengthened. Rosters in the top decile for total ADP value went 1.10 → 1.24. Reaching stayed roughly as punishing (0.89).
And the quarterback lever is the one I can't read from this test. The simulation says a round 3—4 quarterback is worth +35%, reversing 2025's −30%. That's an artifact: 2025's second-ranked QB by ADP was Josh Allen, and rank-preserving mapping hands him 2026's QB2 price, which lands in round four. The cell is measuring "Allen had a great season," not a price effect. With only about fifteen relevant quarterbacks, this method can't separate the two. I'm leaving the QB findings on the 2025 measurements and flagging them as unresolved. That being said, Lamar was QB1 in ADP last season and is now that QB2. There is the opportunity at the cost in Round 4. The elite tier at QB was repriced and we shouldn't ignore it.
The new target shape
Running every early-RB and total-RB combination through the simulated field, the best available shape at 2026 prices is three early backs and five total — 1.32× the field rate. Three early and six total is next at 1.28×.
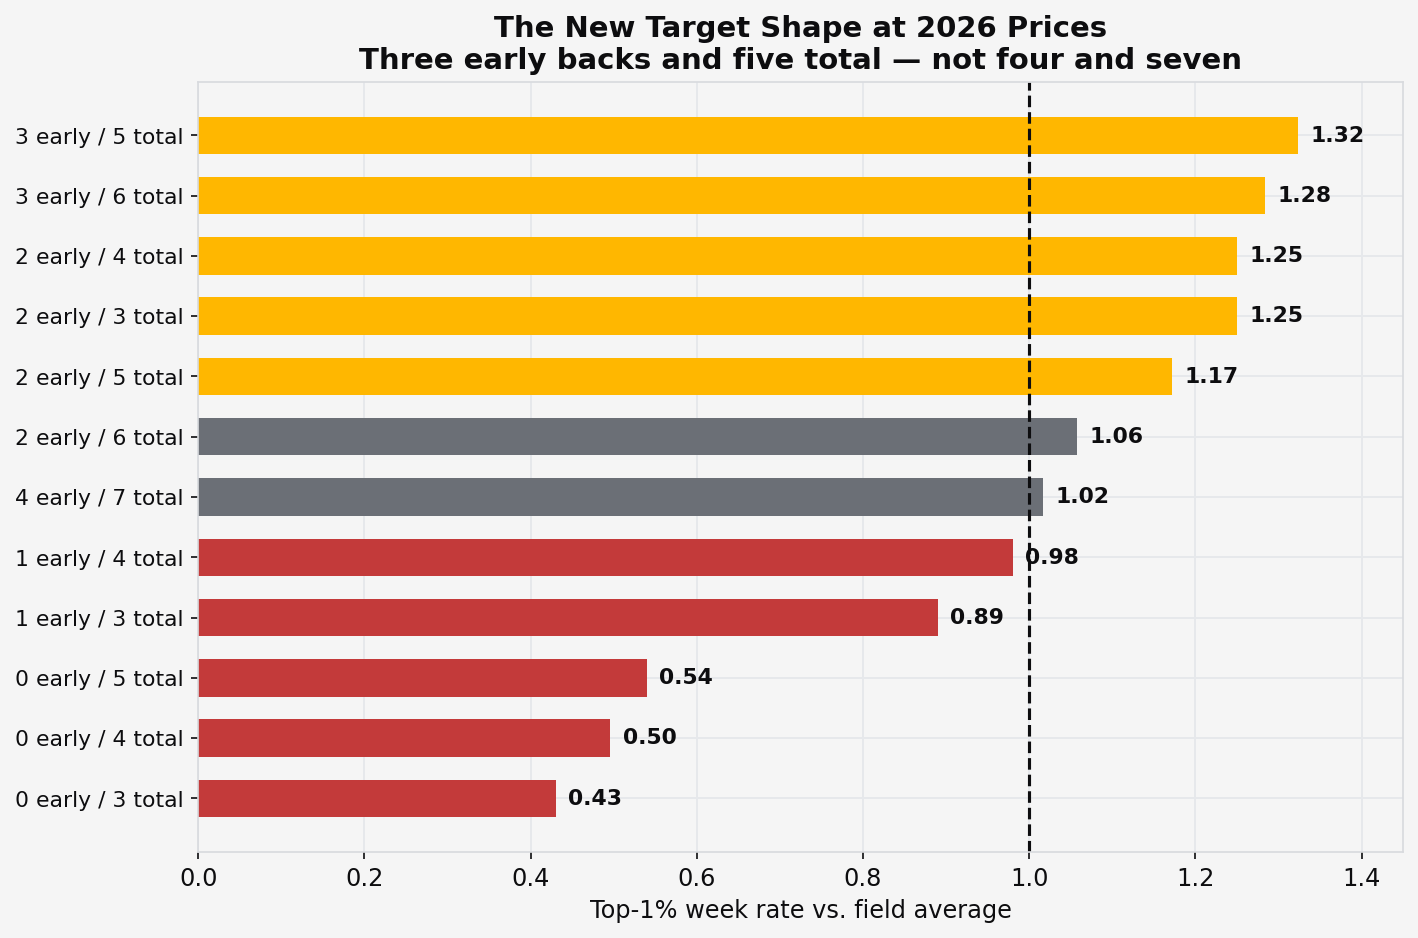
Four early and seven total, the shape closest to what won me Week 8, comes in at 1.02× — indistinguishable from an average entry.
Also worth noting: two early backs and four total sits at 1.25×, nearly matching the best shape. The cheap version of this strategy still works. You do not have to mortgage your draft to get most of the available edge, which was emphatically not true a year ago.
The tiebreaker: volatility, once you've matched the projection
There's one more thing the simulated field can answer, and it's the question you actually face on the clock: two players you value about the same, one steady and one erratic. Which one?
For every player I measured a scoring level and a volatility — the week-to-week variation around their own average — then scored every roster on both. Holding a roster's total projection fixed and splitting it into a steadier half and a spikier half, the spikier half wins more at every level of quality.
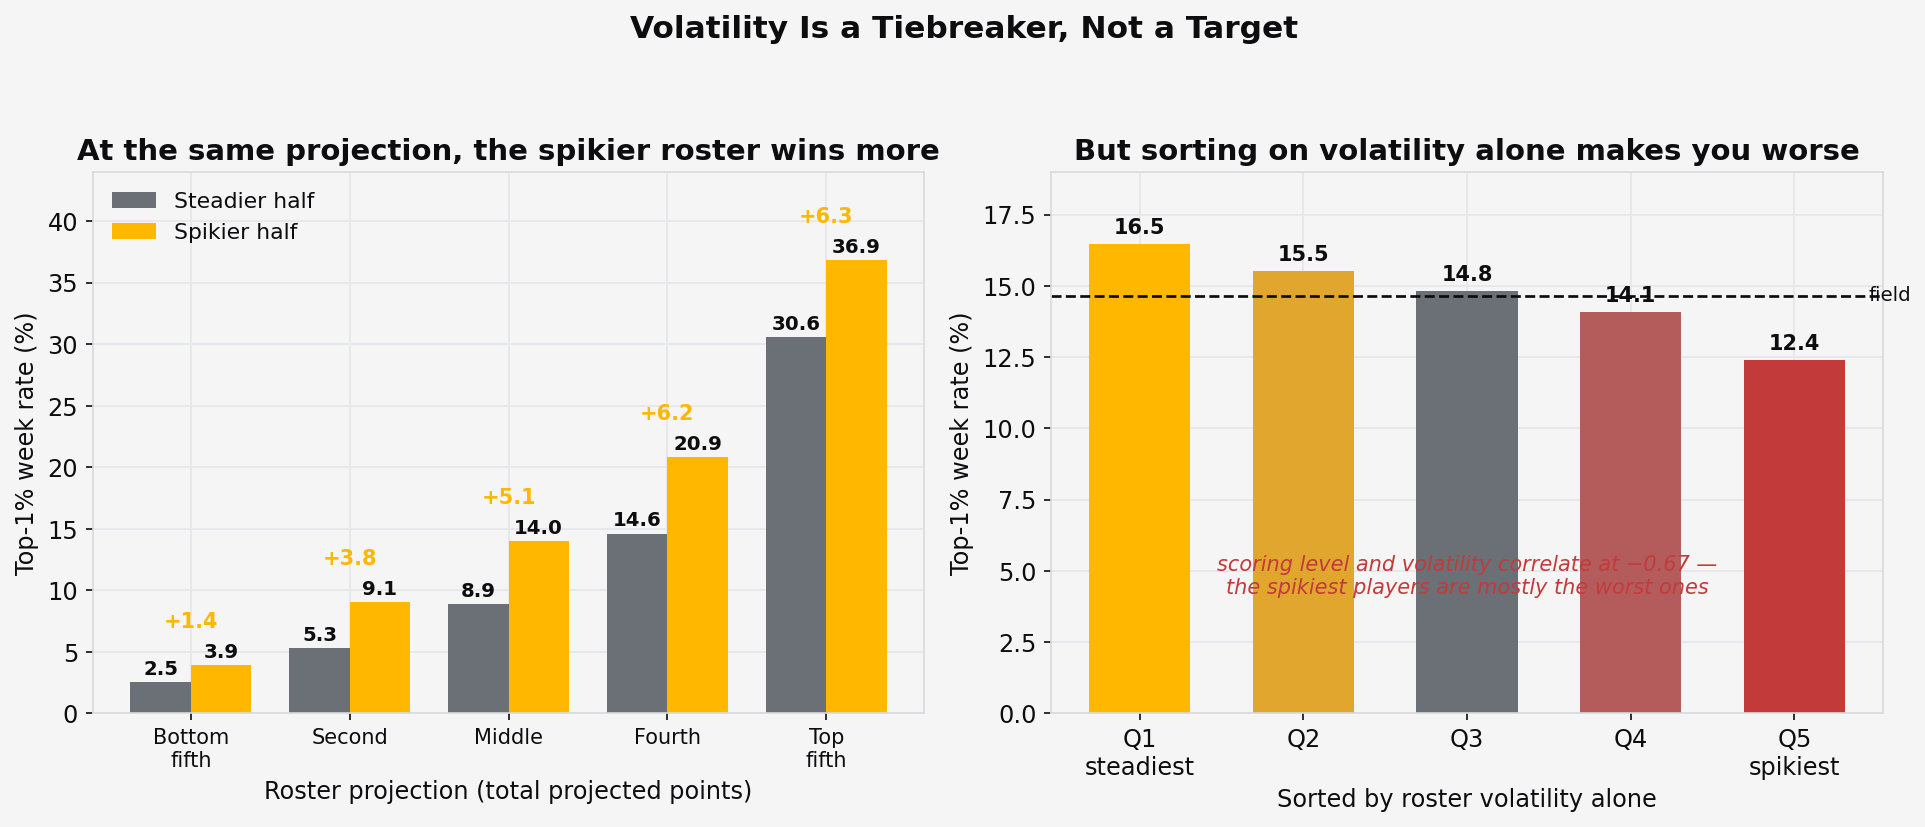
At the bottom of the projection range the gap is +1.4 points of top-1% rate. At the top it's +6.3 — 30.6% for the steady rosters against 36.9% for the spiky ones. The top-0.1% rates roughly double in the middle bands. The better your roster already is, the more volatility is worth, which follows from everything else in this study: you need a handful of players spiking in the same week, and a wider distribution is simply more likely to produce one of those weeks.
It holds at every position, and it gets stronger the more of that position you carry — the running back gap grows from +1.5 with three backs on the roster to +4.3 with seven. That surprised me. I expected extra bodies to dilute it, on the theory that more players means more paths into the lineup and less dependence on any one distribution. The opposite is true, and I think the reason is that every additional volatile body is another independent chance of landing in whatever week the roster catches fire. They compound instead of crowding each other out.
But this is strictly a tiebreaker, and the trap is severe. Sort rosters by volatility alone, ignoring projection, and the spikiest fifth reaches a top-1% week 12.4% of the time against 16.5% for the steadiest — clearly worse than the field. Scoring level and volatility correlate at −0.67: the most erratic players are overwhelmingly the least productive ones. Chasing variance for its own sake just walks you into the bottom of the player pool.
So the rule is narrow and it matters that it stays narrow. Match on projection first. Then, and only then, take the wider distribution. Never give up projected points to buy volatility — but when you genuinely can't separate two players, the spikier profile is the better Weekly Winners pick.
What I'd actually tell you to do
- Take three early backs, not four. The fourth costs more than it returns now.
- Carry five or six total. Depth behind the tier matters more than it did, because the tier is thinner and pricier.
- Don't pay round-three prices for the RB13—18 band. Those backs produced roughly a fifth of the spike weeks of the top tier last season, and they're the ones the repricing pushed into that range.
- Buy the tight end barbell. Elite tier or the round 11—12 pocket, never the middle. This got better in the new landscape, and nobody repriced it.
- Stop reaching. Value discipline is now a larger share of your total edge than the RB staircase is, simply because everything else compressed and it didn't.
What this test can't tell you
Player outcomes are 2025's. This isolates the price effect by holding performance constant, which is exactly what I wanted — but it means nothing here predicts which 2026 players will actually spike.
The field-adjustment assumption is doing real work. My simulated drafters follow ADP. If the human field is stickier than that — if drafters keep building like it's 2025 and only 7% go RB-heavy — then the edge compresses far less than this shows. The truth is somewhere between the two curves, and I genuinely don't know where.
One season of outcomes. Everything rests on 2025's specific results. A second season would tell me which of these findings are structural and which were one year's noise.
That last one is the thing I'm working on now: adding 2026 data when early in the season, so that a year from now this article can be checked rather than believed. The most useful thing about a public prediction is that it can be wrong in public.
The part that didn't change
Underneath all of this, one thing held in both price worlds.
Winning a week takes roughly 206 points. That's about 25 per lineup slot — which means you need four to six players spiking in the same week, not spread across the season. Nothing about that changed when the board moved.
Every finding in this piece is downstream of it. Early running backs worked because they were the cheapest reliable source of simultaneous spikes. When the price moved, the specific answer changed and the question didn't.
Draft for simultaneity. The board will keep moving; that won't.
The tools
The deck from the podcast — 23 slides, every chart from the 2025 study — is free at weeklywinners.pages.dev. That's the full walkthrough of what the original crawl found.
The Portfolio Grader is the piece this article is really the manual for. Upload your Underdog draft export and it grades every entry on nine construction levers, then rolls the whole portfolio up: expected top-1% rate, odds of a profitable season, the biggest gain still available on each roster, and a player filter so you can see whether any individual guy is landing on your good teams or your bad ones.
It has a market-model toggle built in — the exact question this article is about. Score your portfolio at 2025 measured values, at 2026 simulated values, or blended. It defaults to blended, because I don't think either endpoint is right and I'd rather show you the range than pretend the uncertainty isn't there.
Data: complete crawl of Underdog's 2025 Weekly Winners contest — 186,832 entries, 3.36M picks, 17 scored weeks. Simulation: 15,000 drafts / 180,000 entries at 8 August 2026 ADP, scored on 2025 weekly results.
Methodology and disclosure. The dataset is my own — a complete crawl of all 186,832 entries of the 2025 Weekly Winners contest, every pick and every weekly result. Every figure here was computed by querying that data directly. Nothing is estimated.
The analysis, the 2026 simulation, the charts and this site were built with Claude, working against my data. The writing was drafted with Claude and edited by me. An earlier version of this analysis had the ADP steam direction backwards and treated an artifact as a quarterback finding. Both were caught before publication — the second is why there’s no QB result in here at all.
Known limits: one season of outcomes, calibration fitted in-sample, and a simulation that assumes drafters follow ADP. If the field is stickier than that, the compression is smaller than it looks.